Alternatives for Granting Equity Shares in a Low Stock Price Environment – Follow-Up

This Viewpoint is a follow-up to our previously issued Viewpoint entitled “Granting Equity in a Low Share Price Environment”
That article highlighted an issue facing many companies in early 2016. That is, for companies whose share price is down significantly since last year’s equity grants, share grants in 2016 have the potential to be two to three times larger (or more) in number of shares than those granted in 2015. This can pose a number of problems ranging from creating potential windfalls when share prices recover to previous levels to exceeding maximum share grant levels contained in a shareholder approved equity incentive plan. Our research of historical proxy disclosures for approximately 200 manufacturing companies suggests that among those with lower stock prices in 2008 and into early 2009, 70% lowered their CEO long-term incentive values in 2009 as well. This Viewpoint furthers our research performed on the approximately 200 manufacturing companies to answer the following two questions:
- For those companies in the sample that lowered their CEO’s long-term incentive value in 2009, what was the actual or “realizable” value of those awards three years later when compared to the target value at grant?
- How did the 2009 award realizable values compare to those made in a more normal period, such as 2011?
The decision to reduce executive long-term incentive values during times of depressed stock prices can be difficult. One of the objectives of our research is to provide additional insight for Compensation Committees to consider when contemplating this decision. During these times, company executives are generally working even harder to improve performance and any type of reduction in compensation can be viewed as a takeaway. Further, the motivational factor of executive compensation arrangements needs to be strong throughout the business cycle. Our research is not necessarily industry specific but rather focuses on a group of companies whose stock prices were significantly reduced during the recession of 2008 and 2009. This information can provide valuable insights for companies in different industries whose stock price is significantly lower in 2016 when compared to 2015.
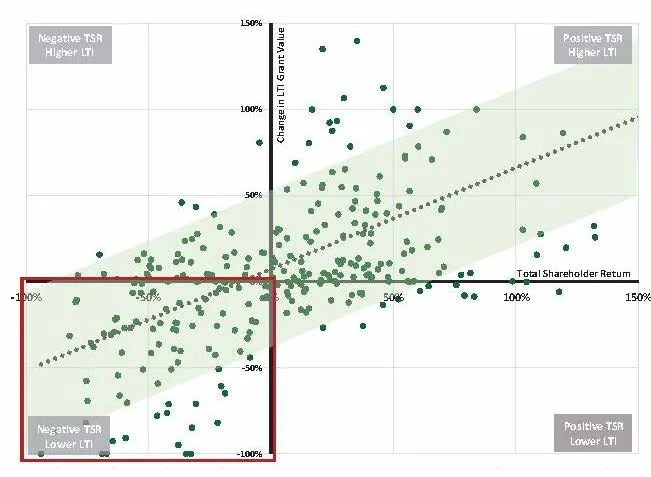
The chart on the following page illustrates how long-term incentive grant values were largely reduced in 2009 when compared to 2008 grant values for those sample companies with negative TSR in 2008 and 2009 (left of the y-axis). It also illustrates how long-term incentive grant values were increased in the subsequent recovery period of 2010 and 2011 (right of the y-axis).

Long-term incentive grants made in 2009 were generally lower in grant value but were higher in terms of the number of shares or stock options granted when compared to 2008. We established that the more significant the decrease in stock price the larger the reduction in long-term incentive grant value. Our focus now is to determine the realizable value of these grants made in 2009.
To accomplish this, we examined the companies in the lower left quartile of the chart above and calculated the realizable value of the 2009 grants three years later in 2012 when these grants were likely vested and earned. Stock prices had mostly recovered by 2012 and were well on their way to the bull market that began to erode in 2015. This increase in stock price contributed to the realizable value in a very meaningful way. For comparison purposes, we examined the realizable value of grants made in 2011, which we deemed as more normal grants made in a more normal level of economic activity. The table below summarizes the realizable value of the 2009 and 2011 grants.

This suggests that the grants made in 2009 ultimately produced two times more realizable value as a percent of grant value at median (309% versus 142%) and three times more realizable value at the 75th percentile (633% versus 233%) than the realizable value of grants made in 2011. Shown differently, this suggests that a grant value of $1,000,000 in 2009 ultimately was worth $3,090,000 at median and $6,330,000 at the 75th percentile by 2012. Given that most executives don’t sell shares upon vesting or being earned due to stock ownership requirements, the value of these shares continued to increase as stock prices continued to increase in 2013 and into 2015. For those companies who granted stock options as part of their long-term incentive program, the increases in intrinsic (“in the money”) value relative to the Black-Scholes grant value was even more dramatic. The table below summarizes the intrinsic value of stock option grants (usually made in addition to restricted stock awards and or performance awards) made in 2009 and 2011.

This suggests that a stock option grant valued at $500,000 (Black-Scholes) in 2009 had an intrinsic value of nearly $3,000,000 in 2012 at the median and $6,000,000 at the 75th percentile.
Conclusion
As we enter the period of determining equity compensation awards, Compensation Committees will need to consider a number of factors such as the magnitude of the decrease in stock price, the number of shares to be granted in relation to prior years and plan limits, and the potential future value of these awards. If a decision to decrease long-term incentive values is the right decision for your company, keep in mind that if history provides any insight into the future, these grants will likely be more valuable than any of the grants made since 2009 and should be factored into the communication with award recipients.


