Demonstrating Alignment of CEO Pay and Performance

Introduction
Realizable pay (“RP”) is composed of cash compensation paid (e.g., salary, actual bonus awards and payouts of cash-based long-term incentives) and the value of equity awards using the stock price at the end of the assessment period. RP assesses outcome-based compensation and has long been the “gold standard” for demonstrating shareholder aligned pay for performance. RP incorporates stock price performance, which is critical because the majority of executive pay opportunity is equity-based compensation. However, such analyses have generally not been extensively used and, if performed, are not typically disclosed in the proxy. This all changed with the SEC’s finalization of the Pay Versus Performance (PVP) rules, which were mandated under The Dodd-Frank Wall Street Reform and Consumer Protection Act. The PVP rules became effective for companies with fiscal years ending on or after December 16, 2022; after a 2-year phase-in period, companies are now required to compare the compensation actually paid (CAP) to the CEO and the average of the other NEOs to the company’s total shareholder return (TSR) and other financial measures over a 5-year period (3 years for Smaller Reporting Companies).
In its final rules, the SEC acknowledged the importance RP played in shaping the new PVP disclosure requirement:
“We believe that theadopted approach in the final rules is similar to the concept of realizable pay, recommended by some commenters, as it reflects an attempt to measure the change in value of an executive’s pay package after the grant date, as performance outcomes areexperienced.” [i]
Based on our research, there is a very strong correlation between CAP and TSR across the S&P 500, and much can be learned from this disclosure. However, the PVP rules have several shortcomings that require additional analysis to gain a complete understanding of just how aligned compensation is with performance, as discussed below. We believe that RP provides more accurate insights, however, the gathering of this information may be more time intensive than using the CAP amounts reported by the company and its peers in the PVP tables.
This Viewpoint discusses how to use outcome-based compensation such as RP or CAP to demonstrate shareholder aligned pay, the major differences between CAP and RP, potential causes for a pay for performance disconnect, and possible ways to improve alignment.
Background
The core provisions of the current SEC compensation disclosure rules were initially promulgated in October 2006 and became effective for companies with fiscal years ending after December 15, 2006. These rules represented a major overhaul of the prior compensation disclosure requirements and introduced the Compensation Discussion and Analysis (CD&A), Summary Compensation Table (SCT), Grant of Plan Based Awards Table (GOPBAT), and Stock Options Exercised and Stock Vested Table, among many other new disclosure requirements. At the time the rules were issued, SEC Commissioner Christopher Cox stated:
“The better information that both shareholders and boards of directors will get as a result of these new rules will help them make better decisions about the appropriate amount to pay the men and women entrusted with running their companies. Shareholders need intelligible disclosure that can be understood by a lay reader without benefit of specialized expertise or the need for an advanced degree. It’s our job to see that they get it.”[ii]
These rules indeed provide several insights into a company’s compensation philosophy, executive compensation decision process, use of peer groups to establish compensation levels, rationale for the selection of annual and long-term incentive measures, grant date values for equity awards, and performance used to determine the amount of annual incentives and long-term performance-based awards that were earned during the year. These insights are very effective from a corporate governance perspective, as they allow shareholders to better understand compensation committees’ rationale for the pay opportunity awarded each year.
The impact of the 2006 disclosure changes, however, did little to further shareholders’ understanding of how pay outcomes moved with shareholders’ results and placed too much emphasis on the grant date value of equity incentives as determined under ASC 718 (previously FASB 123R). It is difficult to overstate the emphasis the SEC ” and investors, academics, the media, and proxy advisory firms ” placed on the “one number” reported in the SCT for total compensation. For example, the SEC’s Director of Corporate Finance, John White, stated at the time the rules were issued:
“Investors will now be provided with one number (our emphasis) for total annual compensation for each named executive officer. The clarity and comparability of this one number will be complemented by the principles-based narrative disclosures in our new Compensation Discussion and Analysis section and by the requirement that these disclosures be made in plain English.” [ii]
The lack of performance-adjustments on pay, especially equity, and emphasis on the one number led to the creation of new but flawed pay for performance models. These include those developed by the proxy advisory firms to inform their highly impactful Say on Pay voting recommendations that rely almost exclusively on the total compensation amount reported in the SCT. These models have determined in dozens of instances that compensation was not aligned with performance, whereas an outcome-based model would have shown far better alignment. This problem persists today, as a high percentage of the proxy advisors Against recommendations appear to be heavily influenced by quantitative pay for performance models (Record Low ISS S&P 500 Say on Pay Opposition: The Trends Behind the Decline). This could be changing, as the proxy advisory firms have indicated they may consider the PVP disclosure in their qualitative assessment of a company’s compensation program when forming their Say on Pay voting recommendations.
To combat the overemphasis on the grant date value of long-term incentives, companies, compensation consultants (including Pay Governance), and some institutional investors developed their own pay for performance models that relied on outcome-based pay models concepts such as RP. These models considered pay outcomes and company performance over a select performance period (e.g., 3-5 years). In some cases, companies included these analyses in the CD&A to demonstrate shareholder-aligned compensation and assist in more effective communications with investors about such alignment.
The following sections discuss RP and PVP, provide a detailed comparison of these two approaches, discuss possible causes of a misalignment of pay and performance, and the potential adjustments that can be made to improve future alignment.
RP
RP is a relatively straightforwardconcept and includes the sum of actual cash compensation earned, the aggregate value of in-the-money stock options, the current value of restricted shares, actual payouts from performance-share or -cash plans, plus the estimated value of outstanding performance-share or -cash plans granted during the performance period being examined (typically 3-5 years). It is also assumed that all shares earned during the performance period are held until the end of the applicable performance period.
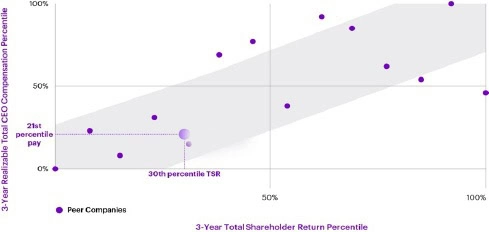
When performing a RP analysis, the CEO’s RP is compared to that of the RP of the peer companies’ CEOs to determine the subject company’s percentile rank. The company’s TSR (or any other appropriate financial measure) is also compared to the TSR of its peers to determine the company’s performance percentile rank. The resulting RP and performance percentiles are then compared to determine if there is an alignment of pay and performance. For example, 50 th percentile RP and TSR would indicate a perfect match of pay outcomes and performance. In practice, however, perfect alignment rarely occurs, but pay outcomes within certain ranges (for example, between the 40 th and 60 th percentile) would likely demonstrate sufficient alignment to the Board and shareholders.
Below is a sample disclosure of RP included in a recent proxy (company name omitted in accordance with our editorial policies). It illustrates strong alignment between CEO RP (at the 21 st percentile) and relative TSR (at the 30 th percentile):
The SEC was concerned that RP and its disclosure, as described above, were not calculated consistently across companies, typically when valuing performance-based equity awards and stock options (which are often the largest components of CEO pay) and therefore worked diligently to develop a model that would allow for comparability across companies.
PVP
As noted, the PVP rules were mandated under the Dodd-Frank legislation. At the time the rules were being finalized, there was a recognition by Congress that the existing disclosure requirements, which focused on SCT compensation, failed to demonstrate shareholder alignment of compensation and performance and that such disclosure could help mitigate excessive risk taking by executives.
The most revolutionary aspect of the PVP rules was the definition of CAP, which provides for updates to the grant date values of equity incentives included in the SCT for actual stock price and the performance factor of performance-based equity awards. The PVP disclosure of CAP and the related performance data were intended to approximate an RP analysis but fell short in one major way: they do not provide comparisons of both pay and performance on a relative basis. This relative comparison of pay and performance is what provides investors with context for the quantum of pay and is critical to reaching meaningful conclusions about the pay for performance relationship.
Understandably, the SEC could not require the inclusion of peer CAP comparisons alongside the peers’ TSR data, as such compensation data is not available until the proxy filings of all the peers are made available publicly. But once filed, this data can be used in a similar fashion as RP to compare the percentile rank of the CAP data with relative TSR or any other appropriate financial measure to determine if pay outcomes are aligned with performance.
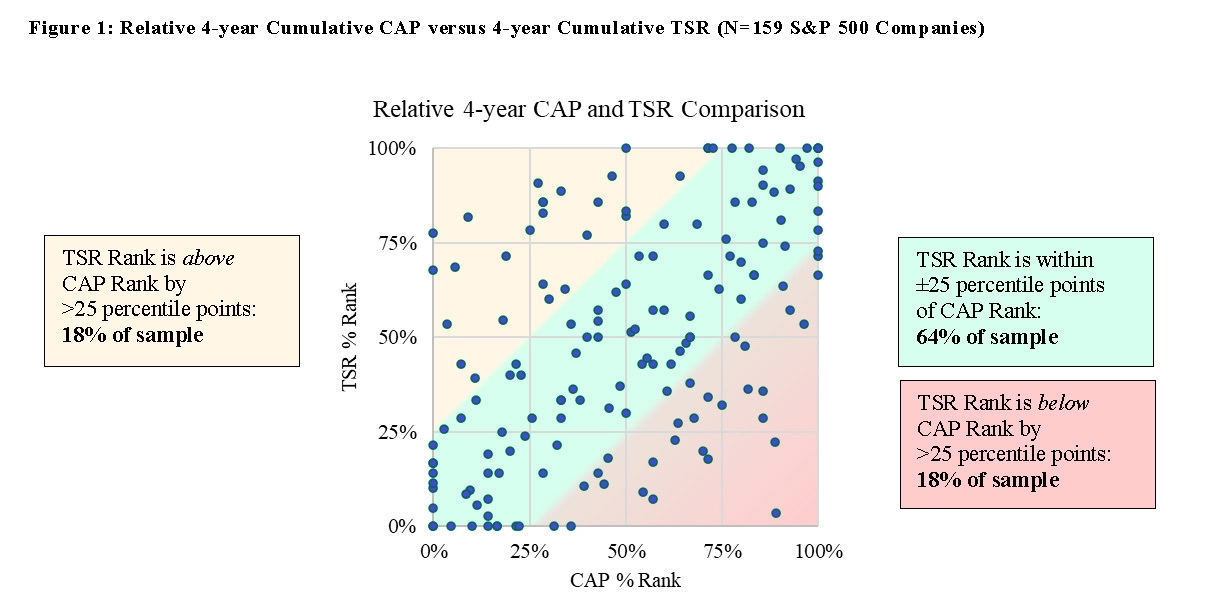
Pay Governance conducted an analysis of the most recent PVP disclosures covering the 2020-2023 performance period and found a statistically significant correlation between cumulative 4-year CAP and TSR. In addition, several companies studied also had shareholder-friendly pay outcomes (we generally define a shareholder-friendly outcome when TSR rank exceeds the CAP rank by more than 25 percentile points). Key findings shown below:
- Correlation between TSR rank and CAP rank was 0.56
- The percentage of companies that falls within ±25 percentile points (the green zone) was 64%
- The percentage of companies that falls within the yellow zone (shareholder-friendly outcomes) was 18%
Comparing CAP and RP by Element
The following compares key elements of RP and CAP and is intended to provide the relative pros and cons of using these measures to assess shareholder-aligned CEO pay and performance.
A typical RP methodology measures both pay and TSR performance on a relative basis (i.e., using percentile ranking). This normalizes the results and allows for more useful comparisons to peers. In addition, RP analyses may include other important metrics relevant to a company, allowing relative performance evaluations to be conducted across several performance metrics in addition to TSR.

Salary, bonuses, and annual incentives are the least contentious components of compensation in terms of how they should be measured. However, CAP does not annualize or make any adjustments for newly hired executives, which can result in distortions of annual cash compensation.
With RP, Pay Governance investigates each incumbent to present the truest picture of annual cash compensation. This often involves reading CD&A’s and 8-Ks to find salary rates or annualizing amounts based on hire dates.
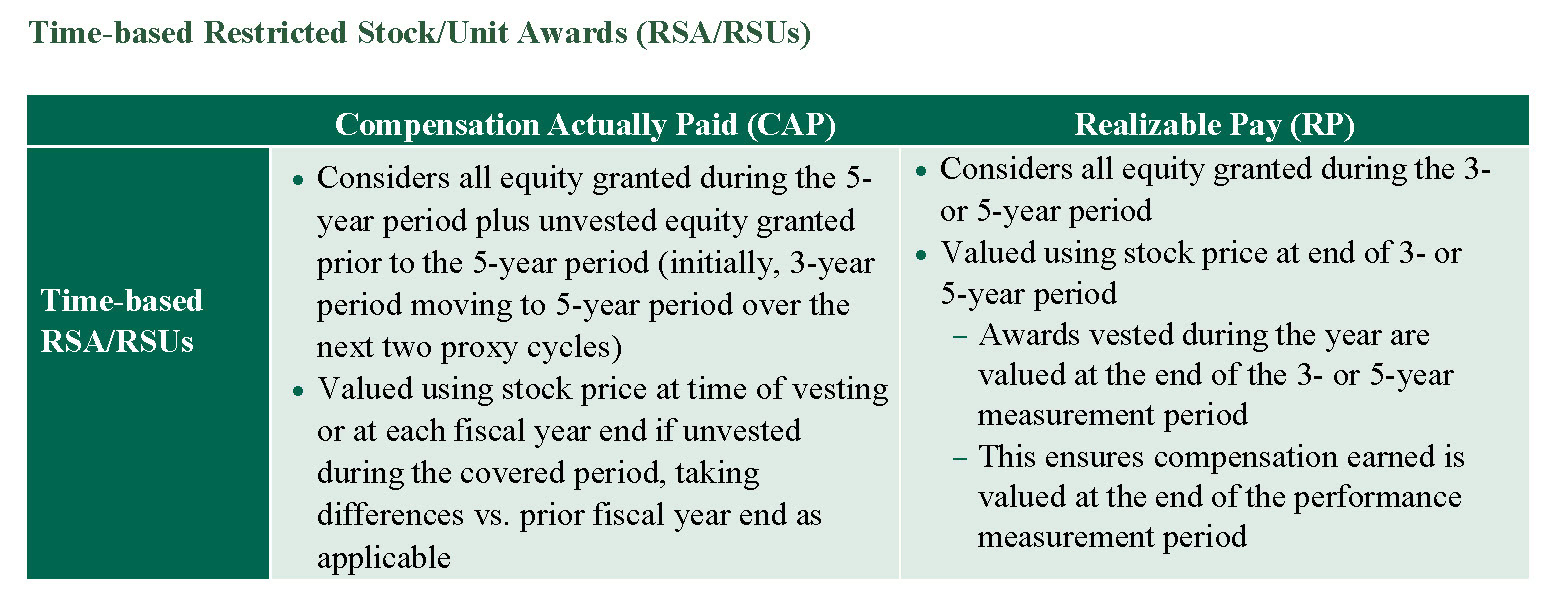
CAP can overstate or understate compensation for a given year by including the change in value of grants made in years prior to the PVP performance measurement period . These prior year awards often include tranches of equity awarded 3 and 4 years prior to the commencement of the PVP measurement period. It is essential that when using this type of analysis to try to match the performance and pay (mostly stock grants) periods as much as possible. Indeed, based on Pay Governance’s analysis of 160 S&P 500 companies, the change in CAP was significantly affected by the change in value of the prior year awards (74% of the change in CAP from 2021 to 2022 and 58% of the change in CAP from 2020 to 2021) (What Shareholders Can Learn from the SEC’s New Pay Versus Performance Disclosure). The significant proportion attributable to prior year awards is due to the cumulative effect of the number of unvested shares remaining from grants made during these prior periods.
Another difference occurs as CAP stops tracking changes in the value of equity awards once they vest. This SEC requirement essentially assumes the executive sells all the shares immediately upon vesting, which is often not the case. The SEC notes that once vesting occurs, the executive’s decision to retain or sell the shares is an investment decision, and any change in stock price thereafter is unrelated to compensation. In high volatility markets, this valuation approach could differ significantly from other methods, such as valuing at the end of the performance period as does RP.
In contrast, RP assumes that all the shares granted and vested during the 3- or 5-year measurement period are retained until the end of the period to measure the impact of the change in stock price on awards granted during the measurement period. While this assumption ignores that some shares may have been sold or withheld to cover taxes and exercise price, the impact is normalized on a relative basis, as RP makes the same assumption for all companies in the peer group.
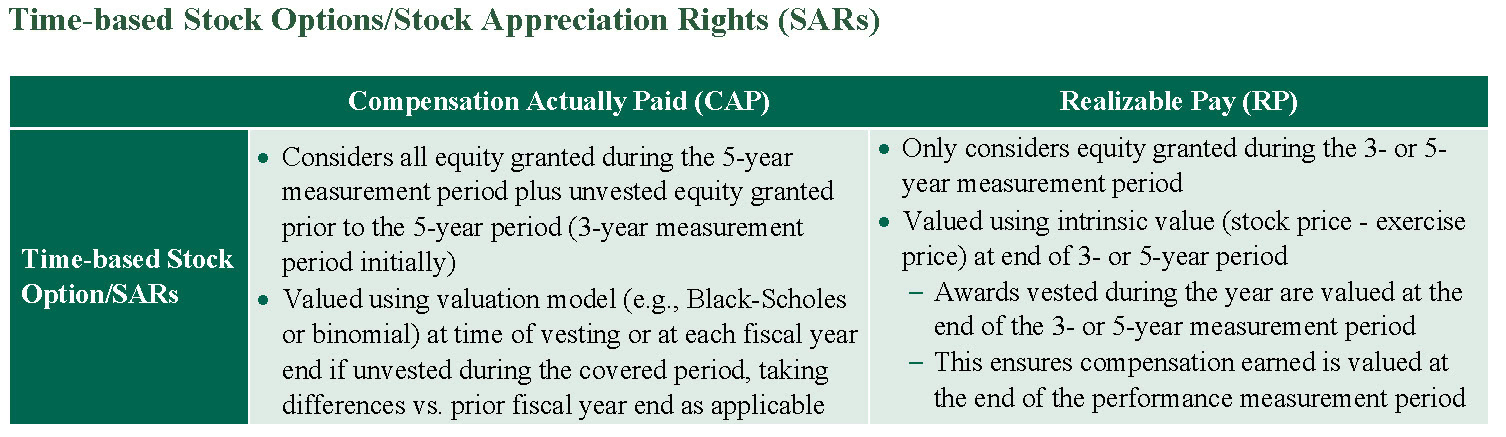
The same points discussed above for time-based RSAs/RSUs regarding an overstatement of compensation due to including equity grants made outside the measurement period and disconnect of valuing awards at vest are also true for time-based stock options and SARs.
In addition, there is typically a large variance observed between CAP and RP due to CAP’s use of expected valuation models, (e.g., Black-Scholes) versus RP’s use of intrinsic value. This variance is most pronounced for underwater stock options and SARs, where RP would include a value of $0, and a Black-Scholes valuation used to determine CAP will often include a material value based on the award’s potential future value (unless awards are significantly underwater).
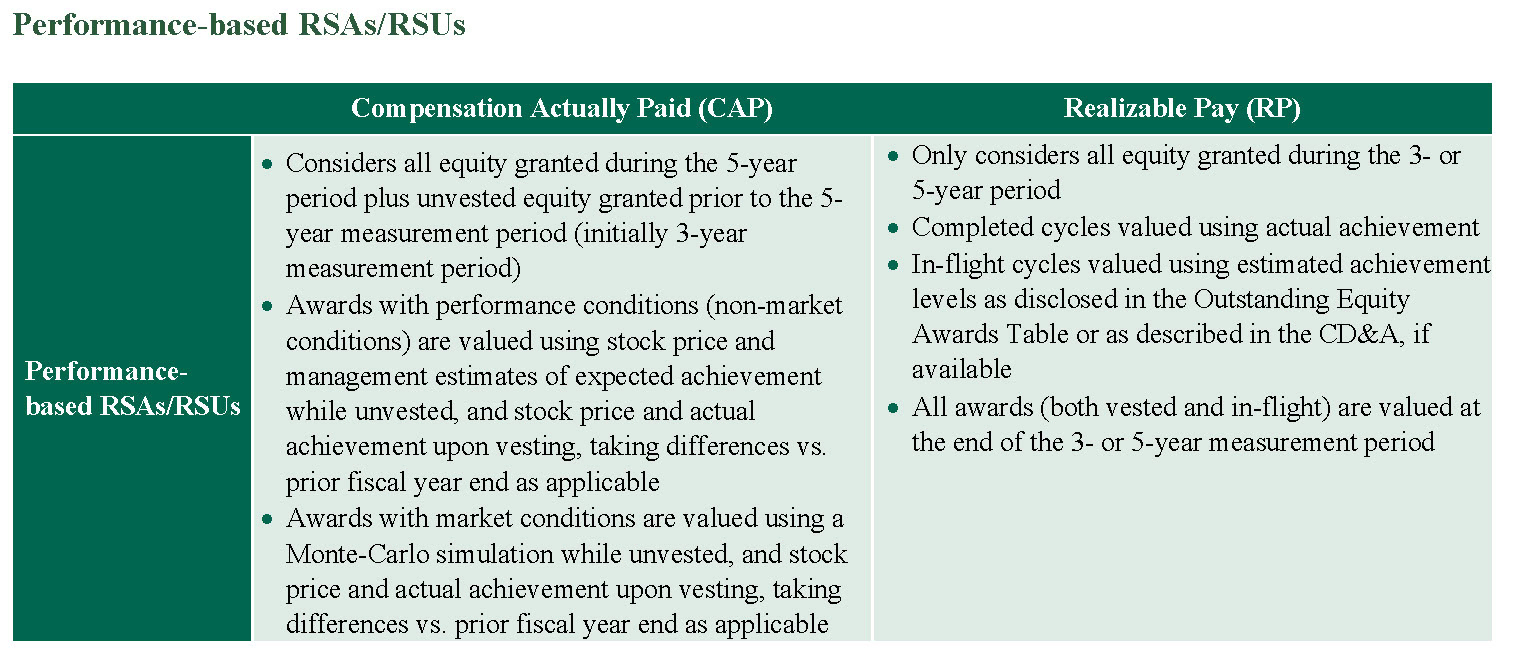
CAP’s requirement that in-flight performance cycles be valued based on expected performance is one of the largest differentiators to RP. Expected performance estimates are often based on confidential information and are rarely disclosed in the PVP table footnotes or the broader CD&A. CAP values for in-flight performance share units (PSUs) that are based on a market condition (i.e., stock price hurdles, relative TSR, or absolute TSR) are based on a Monte Carlo simulation of future performance. RP is based on the estimated payout of performance-based awards and the peer data relies on the footnotes to the Outstanding Equity Awards Table, which discloses actual performance for the most recently completed performance cycle and either threshold, target, or maximum payout levels for the remaining in-flight PSU awards. In cases where companies electively disclose estimated payout levels for in-flight awards within the CD&A, RP will reflect those values.
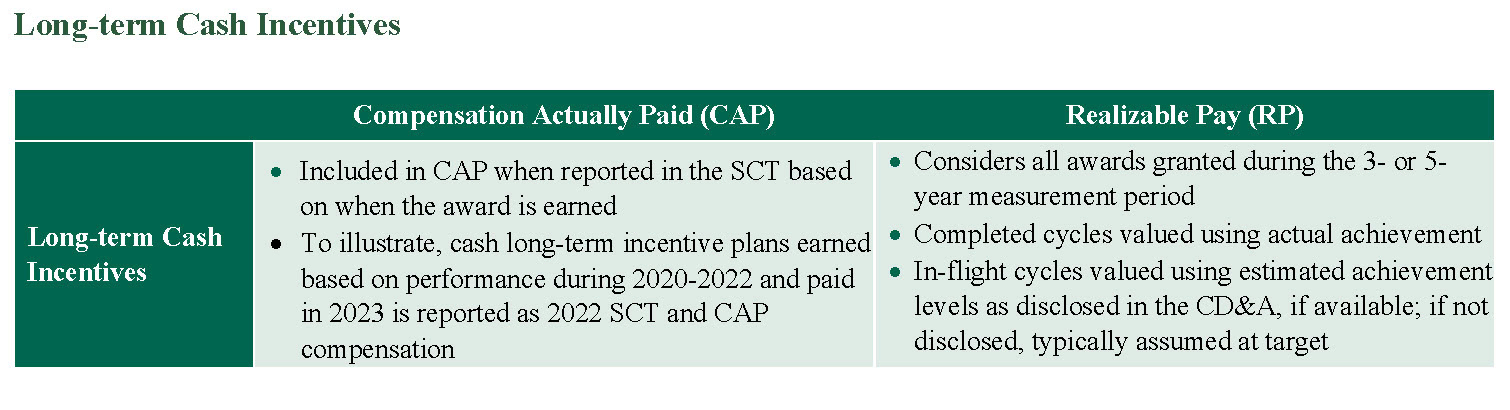
CAP ignores the value of in-flight performance cycles for cash-based long-term incentives, which is at odds with the mark-to-market valuation requirement for equity awards. Thus, CAP ignores what could be a material portion of an executive’s long-term incentive in determining PVP until the final year of the performance period. RP, on the other hand, considers the awards made during the performance period, including payouts of relevant completed cycles and estimated levels of achievement for in-flight awards.

Most companies have either frozen or terminated existing defined benefit plans or never adopted such plans, and very few companies provide preferential earnings on NQDC plans. Moreover, where such arrangements do exist, the impact is generally modest to immaterial. Removing the value attributable to various changes in assumptions of pension plans and only accounting for service cost and prior service cost resulting from plan amendments helps reduce such numbers but could still be present as outliers in an analysis of PVP.
RP excludes all values associated with pension and NQDC plans, as such amounts are generally modest to immaterial. As a practical matter, very few companies would have been willing to incur the expense of calculating the service cost for each executive for each year for inclusion in RP absent the SEC mandate. Now that this data is available where applicable, it could be included in RP should it be relevant and material to a company’s analysis of pay and performance.

CAP includes All Other Compensation as disclosed. In many cases, the values are nominal. However, the inclusion of severance for a terminated CEO or NEO can materially distort the pay for performance relationship. RP excludes all values associated with All Other Compensation due to immateriality and/or to better reflect ongoing compensation.
Relative PVP Implications and Considerations
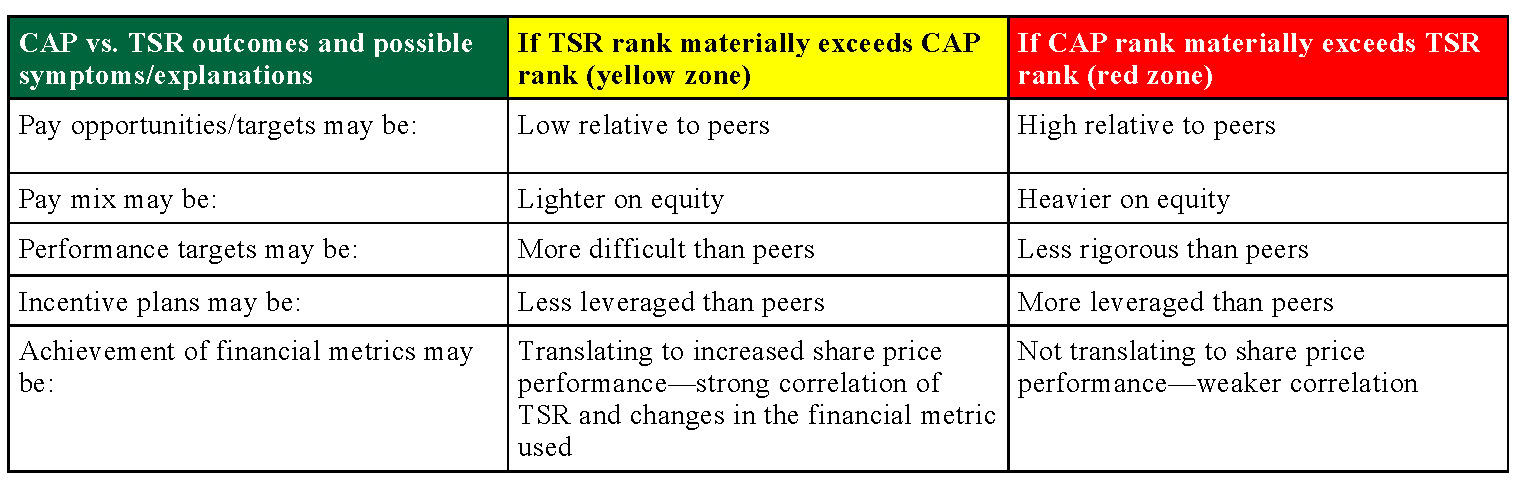
Compensation Committees and management may find that using a relative analysis of cumulative CAP and TSR against a company’s peer group or industry sector can provide a meaningful evaluation of pay and performance, the results of which may help improve compensation programs.
Companies in the green zone, where relative CAP rank is commensurate with TSR rank, indicates that compensation outcomes are consistent with the shareholder experience, and diligent monitoring remains essential to ensure continued alignment. For companies in the yellow or red zones, there may be several program design features that might be worth examining to improve alignment, including:
Conclusion
Both RP and PVP have revolutionized the assessment of executive pay for performance that can be used to demonstrate alignment of pay and performance both internally and externally, rather than relying on a static assessment of pay for performance based on SCT grant values of equity incentives. Indeed, recent academic research suggests that the PVP data is already influencing investors’ voting preferences. [iii]
Whether to use RP or the PVP data to construct a shareholder outcome-based pay for performance analysis may depend on the degree of precision a compensation committee may require when assessing pay for performance, the relative importance of certain pay elements such as cash long-term incentive, and the level of effort the company wishes to expend to prepare the analysis, among other considerations. In either case, these methods are far superior to SCT compensation-based pay for performance analyses, which do not consider pay outcomes and can result in both false positive and false negative conclusions regarding pay and performance alignment.
_________________________