The Impact of Say-on-Pay on S&P 500 CEO Pay

The 2010 Dodd-Frank legislation mandated Say on Pay (SOP) votes aimed at lowering CEO Pay that was deemed as too high and reducing excessive risk-taking due to executive incentives.
In this Viewpoint, we explore CEO pay trends in the post Dodd-Frank Era; key takeaways include:
- Our updated SOP research finds that CEO pay has continued to increase across the spectrum of S&P 500 CEOs post-Dodd-Frank.
- CEO pay increases were reflective of a 64% increase in revenue and more than doubling of market cap for a constant sample of S&P 500 companies over the same period.
- However, as previously observed, annualized increases in CEO pay at the 90th percentile (1.2% annualized increase) were lower than at other percentiles of the CEO pay distribution (3% to 6% annualized increases), generally driven by pressure on absolute CEO pay quantum by proxy advisors and some investors.
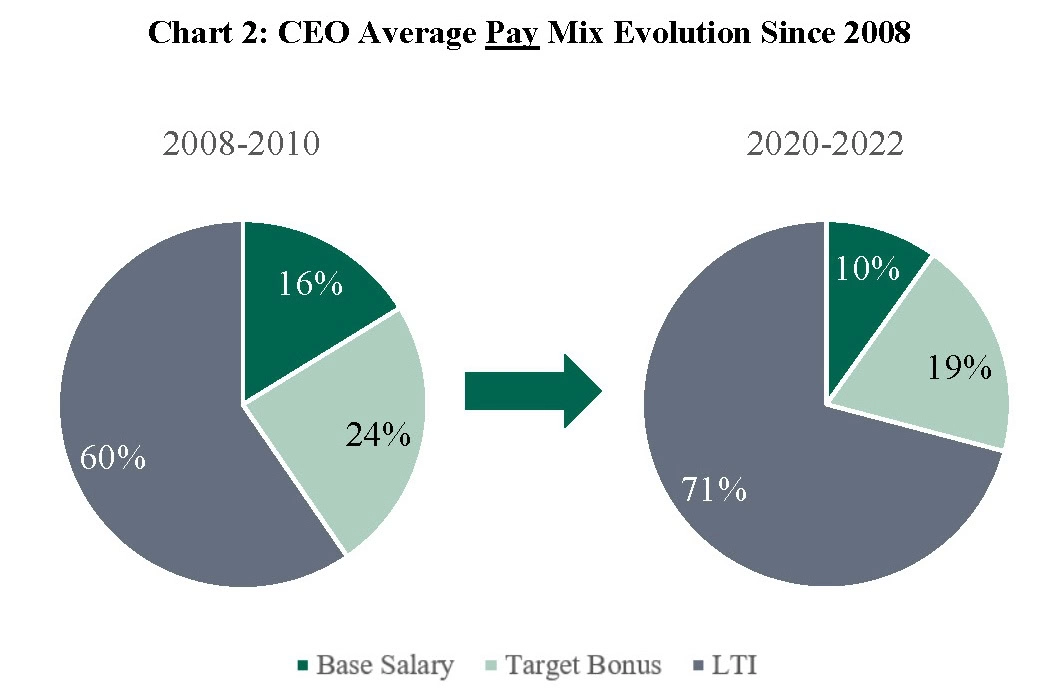
- S&P 500 CEO pay is significantly more performance-based than it was before SOP: today, 90% of CEO pay is delivered in annual or long-term incentives versus 84% before SOP.
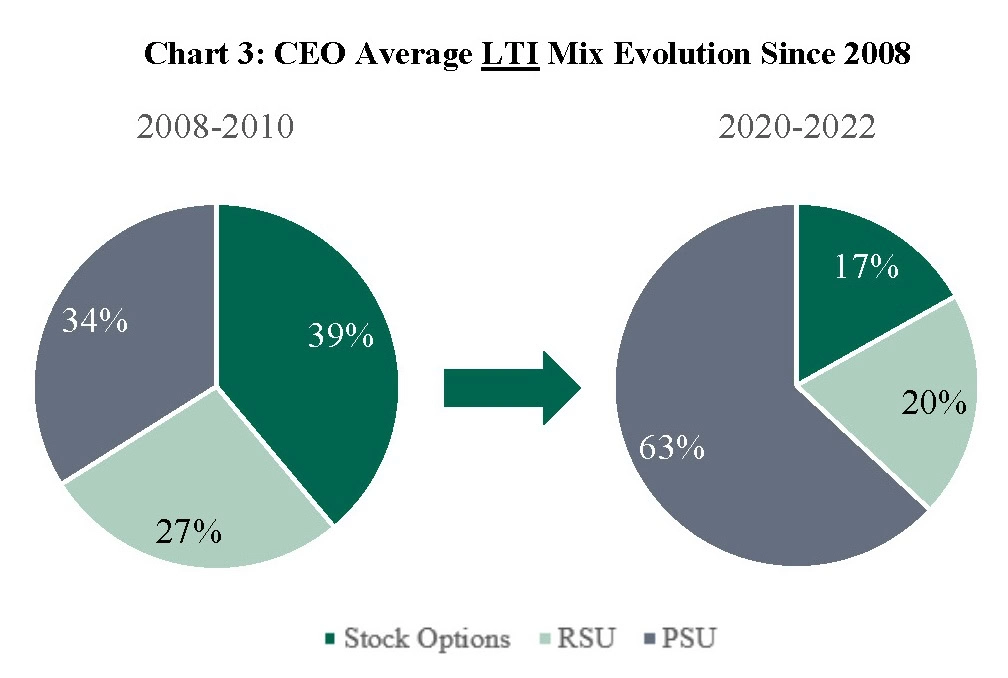
- The mix of long-term incentives has shifted significantly towards performance share units (PSUs): from 34% before SOP to 63% today.
- Average shareholder support for S&P 500 SOP votes near 90% validate CEO pay increases and changes in pay practices since the implementation of SOP.
Introduction
In 2011, the first Say on Pay (SOP) votes ushered in the modern era of executive compensation governance for U.S. public companies. As a result, today’s compensation committee agenda has become significantly more complex than it was before 2011, including understanding proxy advisor views on executive compensation design and, importantly, engaging with investors on SOP hot button items.
What has been the quantitative impact of this increased shareholder democracy on executive pay and the resultant compensation governance focus by institutional investors and corporations?
This Viewpoint provides an analytically quantitative update on how SOP has affected S&P 500 CEO pay more than a decade into the modern era of executive compensation governance using CEO target total direct compensation (TDC) pay data from proxy filings.
As we summarized in our 2017 Viewpoint “Did Say-on-Pay Reduce and/or ‘Compress’ CEO Pay?” , the impetus for including the SOP vote in the Dodd Frank Act was articulated at the time as a means to control executive compensation , with a clear focus on quantum of pay. Proponents at the time theorized that giving shareholders a vote on executive pay would give voice to a chorus of objections over pay levels that commentators panned as outsized. Our 2017 Viewpoint examined the quantitative impact of the new SOP vote in the pre- and post-SOP period and found that giving voice to shareholder views on executive compensation did not reduce market median CEO pay. However, it did result in a compression of CEO pay around the median, as a result of higher CEO pay increases at the bottom and middle of the S&P 500 pay distribution ” 10th, 25th, and 50th percentiles. We also observed a decline in CEO pay after SOP at the 90th percentile relative to pre-SOP CEO pay.
We updated our research in this Viewpoint to look back at the full 13 years after the first SOP votes to understand the impact of increased shareholder voice on executive pay by answering several key questions:
- How did S&P 500 CEO pay change after the implementation of SOP through the current period?
- Has the distribution of S&P 500 CEO pay continued to compress since our 2017 Viewpoint?
- How has the structure of CEO pay changed since the first SOP votes?
How did S&P 500 CEO pay change since the implementation of SOP?
Pay Governance examined CEO pay for a constant-company sample among the S&P 500 index, comprising 166 companies over the 15-year period from 2008-2022. Chart 1 below plots CEO target TDC over the 15-year period, representing the three years before implementation of SOP and 11 years post-SOP. The chart shows that CEO pay has increased at every percentile post-SOP, although increases were less pronounced at the 90th percentile, as we will discuss below.
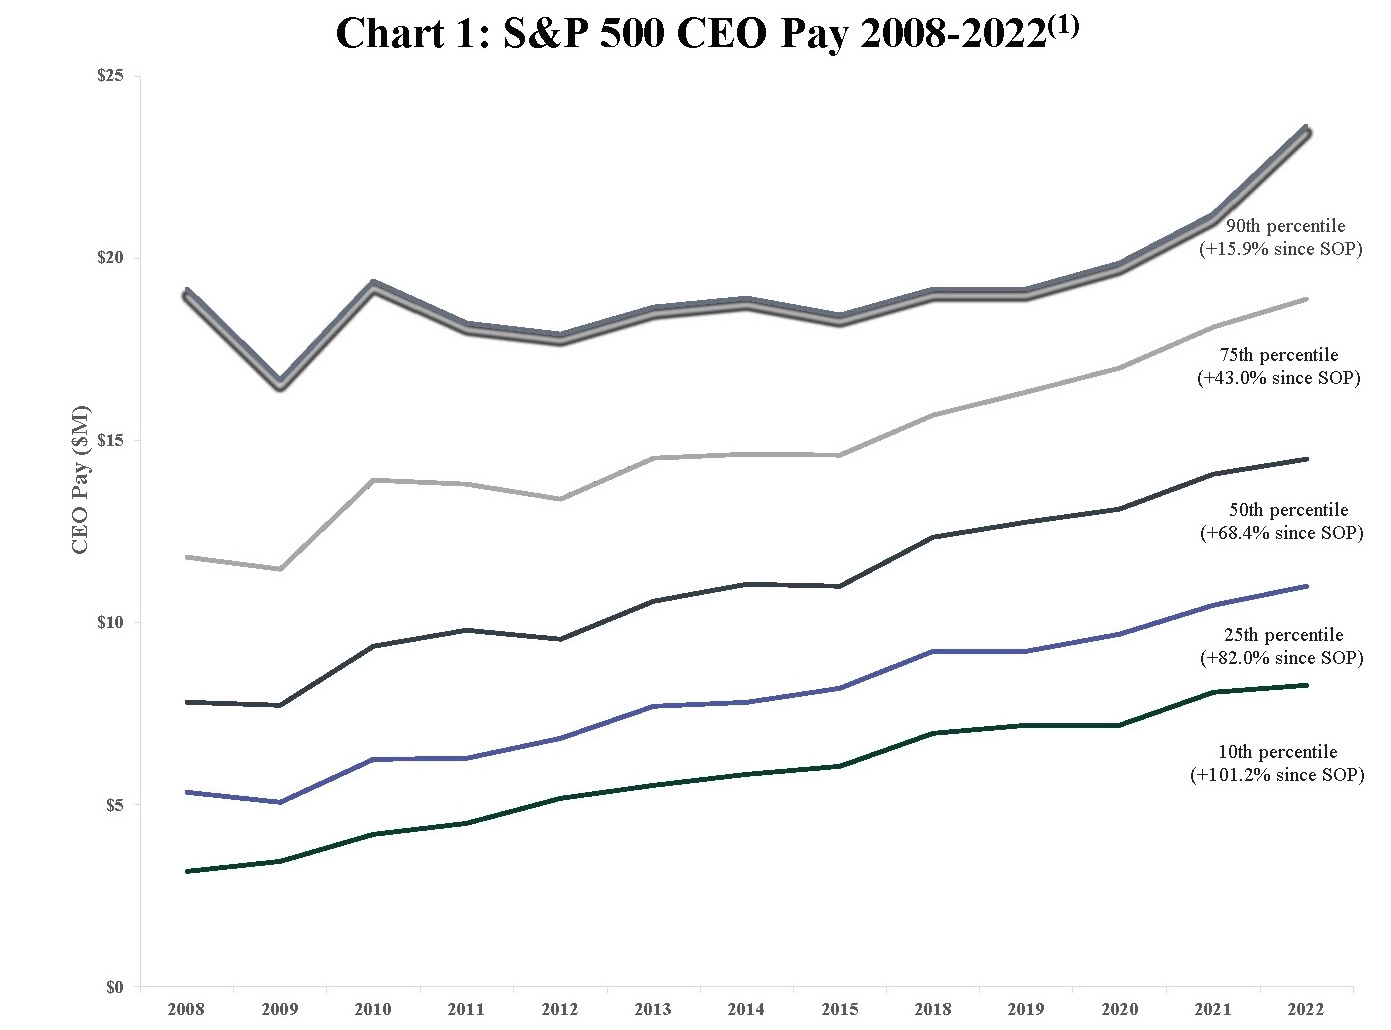
(1) Reflects time series for years included in our data set of 166 constant-companies from 2008 through 2022.
These increases were consistent with continued revenue and market cap growth over the period. Table 1 below shows that sample company market cap at all percentiles more than doubled and revenue at all percentiles increased more than 30%. This greater scoping of companies across the S&P 500 sample is a significant factor in explaining the increases in CEO pay over the period, as CEO pay is closely correlated with the size and complexity of organizations.

CEO Pay Continues to Compress/Flatten at the Top of the Range
As shown in Table 2 below, while CEO pay increased at all percentiles over the study period, increases at the 90th percentile were significantly lower than increases at other percentiles. At the 90th percentile, annualized CEO pay increases were just 1.2%, compared to annualized increases ranging from 3% at the 75th percentile to 6% at the 10th percentile over the period from 2008 to 2022. The large cumulative increases of ~100% at the 10th percentile show how pay for the CEO role at smaller/lower-paid companies are catching up to the overall median.
These observations indicate a continued trend towards CEO pay compression at large public companies. Before SOP, a CEO paid at the 90th percentile was paid 4.5 times a CEO paid at the 10th percentile of the S&P 500; more recently, a 90th percentile CEO is paid 2.5 times the 10th percentile CEO.
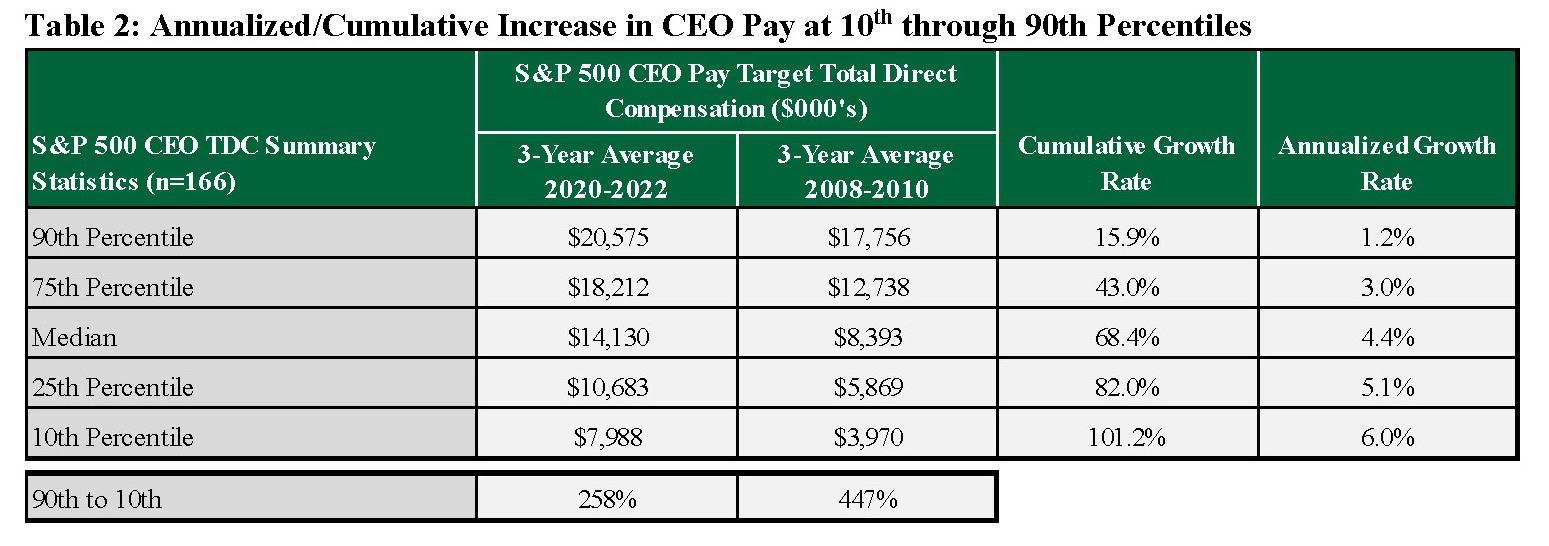
This observation is consistent with our consulting experience and our observation of a historical “$20M soft cap” on CEO pay in which companies with total annual CEO pay above $20M were likely to draw significant scrutiny. This created an increased risk of receiving an “Against” SOP vote recommendation from proxy advisors. The continued growth in the rest of the S&P 500 CEO pay distribution is also consistent with our consulting experience as other S&P 500 companies become larger and more complex. Companies in the 10th percentile of the study sample are now twice as large on a revenue and market cap basis as they were before SOP.
We note, however, that our data sample shows a weakening of the historical “$20M soft cap” as an increasing number of companies have moved CEO pay above this level in connection with increased scale and competition for talent, particularly within the financial, healthcare, and technology sectors. Depending upon industry, company size, and absolute and relative total shareholder return (TSR) performance, that soft cap is now closer to $30 million, based on our research.
Post SOP Changes Focused on the “How” in Addition to the “How Much”
In addition to the continued compression in CEO pay observed above, SOP has changed how compensation is delivered to top executives. The clearest observable impact of SOP is a moderate shift of the total CEO pay mix towards incentive compensation (an increase from 84% of total pay to 90% of total pay) and an even more significant shift in the mix of long-term incentive (LTI) vehicles away from stock options and towards leveraged long-term performance plans: PSUs, on average, comprised 34% of total LTI before SOP and now represent 63% of total LTI.
Beyond the clearly observable compensation mix evolution post-SOP, we observe the following trends that were influenced by the SOP vote and proxy advisor pay program preferences and which have now become typical executive compensation practice:
- Broad adoption of pay-for-performance assessment methodologies measuring “after the fact” executive compensation (realizable pay, SEC Compensation Actually Paid/TSR, and realized pay).
- Increased implementation of policies for the treatment of equity awards upon executive retirement versus use of Committee discretion.
- Near universal movement toward double-trigger equity vesting and elimination of 280G excise tax gross-ups upon a change in control.
Conclusion
Our updated research on CEO pay in the period after the implementation of SOP shows a continuation of our findings in 2017, indicating that the CEO labor market is robust. CEO pay increased across the distribution but at a slower rate among the most highly compensated S&P 500 CEOs (90th percentile). SOP did not “freeze” or significantly alter the dynamics/robustness of the market for CEO pay. Rather, CEO pay across the distribution continued to increase in line with significant growth in the size and scope of the sample companies. While the influence of proxy advisors has likely held down compensation at the 90th percentile of the market, the highest-paying S&P 500 companies have exceeded the “$20M soft cap” on CEO compensation in recent years, particularly in the finance, healthcare, and technology sectors.
CEO pay is now significantly more “shareholder-friendly” and performance-based than it was before SOP, with more dollars of compensation linked to long-term performance goals than ever and arguably more challenging performance-vesting goals. Shareholders, in turn, approve of compensation plans at S&P 500 companies with about 90% support, on average, validating the model for executive pay including the historical increases and the continued shift towards performance-based pay since the passage of Dodd-Frank.
